Banksy Spatial Clustering Analysis
Preface
IMPORTANT
Banksy is a clustering analysis method specifically designed for spatial transcriptomics data. By integrating cellular expression features with spatial neighborhood information, it significantly improves the accuracy of spatial domain identification and cell type discrimination. This method can:
- Effectively handle noise and sparsity in spatial transcriptomics data
- Identify cell subpopulations with similar spatial microenvironments
- Discover spatial functional domains and intercellular interaction patterns in tissues
- Apply to various spatial transcriptomics technology platforms (such as 10x Visium, Slide-seq, MERFISH, CosMX, etc.)
In spatial transcriptomics research, traditional clustering methods often ignore the spatial location information of cells, leading to inaccurate identification of space-related cell subpopulations. Banksy constructs a spatial neighborhood feature matrix, combining each cell's expression characteristics with the expression patterns of surrounding cells, thereby better capturing spatial tissue structure.
Core Functions of Banksy
- Spatial Neighborhood Feature Calculation: Construct neighborhood networks based on spatial coordinates, calculating neighborhood mean and gradient features
- Multi-scale Clustering Analysis: Supports multiple clustering algorithms (Leiden, Louvain, K-means, Mclust)
- Parameter Optimization: Balance the importance of expression features and spatial information through λ parameters
- Visualization Display: Provides spatial clustering distribution maps and UMAP dimensionality reduction visualizations
This document aims to provide spatial transcriptomics researchers with a comprehensive Banksy technical guide, covering its basic principles, operation methods on the SeekSoul™ Online platform, result interpretation, practical cases, and frequently asked questions, helping you quickly master and apply this tool.
Theoretical Foundation of Banksy
Core Principles
The core idea of Banksy is: to build an enhanced feature matrix for clustering analysis by integrating cellular expression features with spatial neighborhood information. This process can be summarized in the following main steps:
- Spatial Neighborhood Construction: Determine spatial neighbor relationships based on the spatial coordinates of cells
- Neighborhood Feature Calculation: Calculate the mean and gradient features of each cell's neighborhood
- Feature Matrix Integration: Integrate original expression features with spatial neighborhood features by weight
- Clustering Analysis: Perform clustering analysis based on the integrated feature matrix
Detailed Algorithm Explanation
Spatial Neighborhood Construction
- Principle: Based on the spatial coordinates of cells or spots, construct a spatial neighborhood network using the k-nearest neighbor method
- Method: For each cell, find its k nearest spatial neighbors
- Parameter: k_geom controls the neighborhood size, typically set to 15 and 30
- Advantage: Can accurately reflect the real spatial relationships of cells in tissues
Neighborhood Feature Calculation
- Neighborhood Mean: Calculate the average expression level of genes within each cell's neighborhood
- Neighborhood Gradient: Calculate the spatial gradient of gene expression within each cell's neighborhood
- Feature Integration: Linearly combine original expression features with neighborhood features by λ weight
Banksy Matrix Construction
- Original Feature Matrix (M): Gene expression matrix of cells
- Neighborhood Mean Matrix (G_mean): Matrix of average gene expression within neighborhoods
- Neighborhood Gradient Matrix (G_grad): Matrix of gene expression gradients within neighborhoods
- Integrated Matrix: B = M + λ × (G_mean + G_grad)
Clustering Analysis
- Dimensionality Reduction: Perform PCA dimensionality reduction on the integrated feature matrix
- Clustering Algorithms: Support multiple clustering methods, including Leiden, Louvain, K-means, Mclust
- Parameter Optimization: Optimize clustering results by adjusting λ and resolution parameters
Biological Significance
Spatial Domain Identification
- Function: Identify functional regions with similar spatial microenvironments in tissues
- Application: Understand biological processes such as tissue development and disease progression
Cell Subtype Discovery
- Function: Discover cell subtypes influenced by spatial microenvironments
- Application: Study cell differentiation and functional specialization processes
Spatial Interaction Research
- Function: Reveal intercellular interactions through spatial proximity
- Application: Study cell communication and regulatory networks
SeekSoul™ Online Operation Guide
On SeekSoul™ Online, the Banksy analysis workflow is designed to be intuitive and user-friendly. You don't need to write code; you can complete the analysis through the parameter configuration interface.
Preparation Before Analysis
IMPORTANT
The success of Banksy analysis largely depends on the quality of input data and the accuracy of spatial information. Before starting the analysis, please ensure:
- Data has been preprocessed: Your spatial transcriptomics data has undergone standard quality control, dimensionality reduction, clustering, and cell type annotation.
- Spatial coordinate information is complete: Ensure each cell or spot has accurate spatial coordinate information.
- Data format is correct: Ensure the input data is in the standard Seurat object or SpatialExperiment object format.
Parameter Explanation
The following table details the main parameters and their explanations for the Banksy analysis module on SeekSoul™ Online.
| Interface Parameter | Description | Recommended Value | Notes |
|---|---|---|---|
| Task Name | The name of this analysis task, must start with an English letter and can contain English letters, numbers, underscores, and Chinese characters. | Example: Banksy_analysis_001 | It is recommended to use meaningful names for easy subsequent management |
| Filter.by | The meta column storage column name in rds for Banksy spatial clustering analysis, required. | orig.ident | Ensure this column contains sample information |
| Filter | The sample name in the meta column of rds for Banksy spatial clustering analysis, required. | Example: sample_001 | Ensure the sample name is consistent with the value in the filter factor column |
| Algo | The clustering method selection for Banksy spatial clustering analysis, with options for leiden, louvain, kmeans, and mclust, required. | leiden | Leiden algorithm is recommended as the first choice |
| Resolution | The number of clusters for Banksy spatial clustering analysis, used when algo selects leiden or louvain. The larger the resolution, the more clusters. | 0.4,0.8 | It is recommended to try multiple values and select the result with the most reasonable biological significance |
| kmeans.centers | Specify the number of clusters for Banksy spatial clustering analysis, used when algo selects kmeans. Enter the specified number of clusters. | 5,10,15 | Need to estimate the number of clusters in advance |
| mclust.G | Specify the number of clusters for Banksy spatial clustering analysis, used when algo selects mclust. Enter the specified number of clusters. | 3,5,7 | Suitable for complex data distributions |
| lambda | The weight of expression and spatial position on clustering effect in Banksy spatial clustering analysis, multiple values separated by commas. | 0.6,0.8 | It is recommended to start from 0.2 and adjust according to data characteristics |
| Number of principal components | Default is 30, used for PCA dimensionality reduction. | 30 | Can be adjusted according to data scale, recommended between 20-50 |
| Note | Custom remark information. | - | Record analysis purposes and special requirements |
Important Notes
CAUTION
- Spatial Coordinate Requirements: Ensure spatial coordinate information is accurate and complete; missing or incorrect coordinate information will lead to analysis failure.
- λ Parameter Selection: The λ parameter controls the importance of spatial information; it is recommended to start from 0.2 and adjust according to data characteristics.
- Clustering Algorithm Selection: Different clustering algorithms are suitable for different data characteristics; it is recommended to try the Leiden algorithm first.
Operation Process
- Enter Analysis Module: Navigate to the "Advanced Analysis" module on SeekSoul™ Online and select "Banksy_SpatialClustering".
- Create New Task: Name your analysis task and select the sample or project to analyze.
- Configure Parameters: According to the above guide, select appropriate clustering algorithms, lambda, and other parameters.
- Submit Task: After confirming the parameters are correct, click the "Submit" button and wait for the analysis to complete.
- Download and View: After the analysis is complete, download and view the generated analysis report and result files in the task list.
Result Interpretation
The Banksy analysis report contains rich charts and data files. The following is a detailed interpretation of the core results.
Result File List
| File Name | Content Description | File Format |
|---|---|---|
*_banksy_colData.csv | Metadata file containing all cell clustering labels, including barcode, sizeFactor, clustering labels for different parameter combinations, and spatial coordinates | CSV |
*_clust_M1_lam*_k50_res*_spatial_cluster_plot.png/pdf | Spatial clustering distribution maps under different λ and resolutions, showing the clustering results of cells in space | PNG/PDF |
*_clust_M1_lam*_k50_res*_umap_plot.png/pdf | UMAP dimensionality reduction visualization maps under different λ and resolutions, showing the distribution of cells in the dimensionality reduction space | PNG/PDF |
NOTE
The meaning of parameters in the file name:
M1: Indicates the use of neighborhood mean featureslam*: λ parameter value (e.g., lam0.6 indicates λ=0.6)k50: Indicates the use of 50 spatial neighborsres*: Resolution parameter value (e.g., res0.4 indicates resolution=0.4)
Interpretation of Spatial Clustering Distribution Map
Chart Structure
- Horizontal Axis: Spatial X coordinate of cells
- Vertical Axis: Spatial Y coordinate of cells
- Color: Different clustering labels, each color represents a spatial domain
Key Interpretation Points
- Spatial Continuity: Good clustering results should show spatial continuity, with adjacent cells tending to belong to the same cluster
- Clear Boundaries: There should be relatively clear boundaries between different clusters
- Biological Significance: Clustering results should correspond to known tissue structures or functional regions
Interpretation of UMAP Dimensionality Reduction Visualization
Chart Structure
- Horizontal Axis: First principal component of UMAP
- Vertical Axis: Second principal component of UMAP
- Color: Different clustering labels
Key Interpretation Points
- Cluster Separability: Cells from different clusters should be relatively separated in UMAP space
- Cluster Compactness: Cells of the same cluster should be relatively clustered in UMAP space
- Outlier Identification: Possible abnormal cells or boundary cells can be identified
Interpretation of Metadata File
The metadata file (*_banksy_colData.csv) contains the following information:
| Column Name | Data Type | Description | Example Value |
|---|---|---|---|
| barcode | String | Cell barcode, used to uniquely identify each cell | "AAGGAATGCTGATTCGTTTCTGCGCTC" |
| sizeFactor | Numeric | Cell size factor, used for normalization processing | 0.168491435461364 |
| clust_M1_lam_k50_res** | String | Clustering labels under different parameter combinations, numbers represent cluster IDs | "2", "11", "4", "12" |
| spatial_1 | Numeric | Spatial X coordinate of the cell | 42357 |
| spatial_2 | Numeric | Spatial Y coordinate of the cell | 10507 |
Interpretation of Clustering Labels
- Cluster ID: Numbers represent different spatial domains; cells with the same number belong to the same cluster
- Parameter Combination: Different λ and resolution parameters will produce different clustering results
- Spatial Coordinates: Used to visualize the spatial position of cells in tissues
TIP
You can compare clustering results under different parameter combinations to select the parameter settings with the most reasonable biological significance.
Application Cases
Case One: Banksy Algorithm Principle Demonstration
- Data Source: Banksy official GitHub README example
- Background: Using mouse hippocampus spatial transcriptomics data provided by Banksy official, demonstrate the basic working principle of the Banksy algorithm.
- Analysis Strategy: Compare the impact of different λ values (0, 0.2) on clustering results, demonstrating the importance of spatial information.
- Core Findings:
- When λ=0 (non-spatial clustering): Clustering results are mainly based on gene expression similarity, with poor spatial continuity.
- When λ=0.2 (Banksy clustering): After incorporating spatial neighborhood information, clustering results are more spatially continuous and consistent.
- Banksy can effectively balance gene expression features and spatial position information, improving the biological significance of spatial clustering.
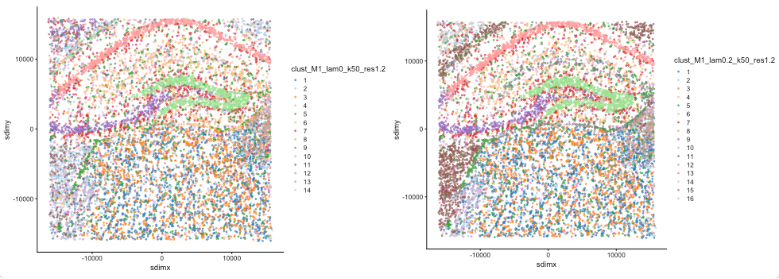
Figure: Banksy algorithm principle demonstration. The left figure shows non-spatial clustering (λ=0), and the right figure shows Banksy spatial clustering (λ=0.2). By comparison, it can be seen that Banksy can better identify functional regions with spatial continuity.
Case Two: Banksy Clustering Separation Effect Demonstration
- Data Source: Banksy official GitHub README example
- Background: Using mouse hippocampus spatial transcriptomics data provided by Banksy official, demonstrate the impact of different λ parameters on clustering separation effects.
- Analysis Strategy: Compare clustering results under two parameter settings of λ=0 and λ=0.2, demonstrating the spatial distribution pattern of each cluster.
- Core Findings:
- When λ=0: 14 clusters are identified, with some clusters having relatively scattered spatial distribution and unclear boundaries.
- When λ=0.2: 16 clusters are identified, with more concentrated spatial distribution and clearer boundaries.
- By increasing spatial weight, Banksy can identify finer spatial structures, improving the biological significance of clustering.
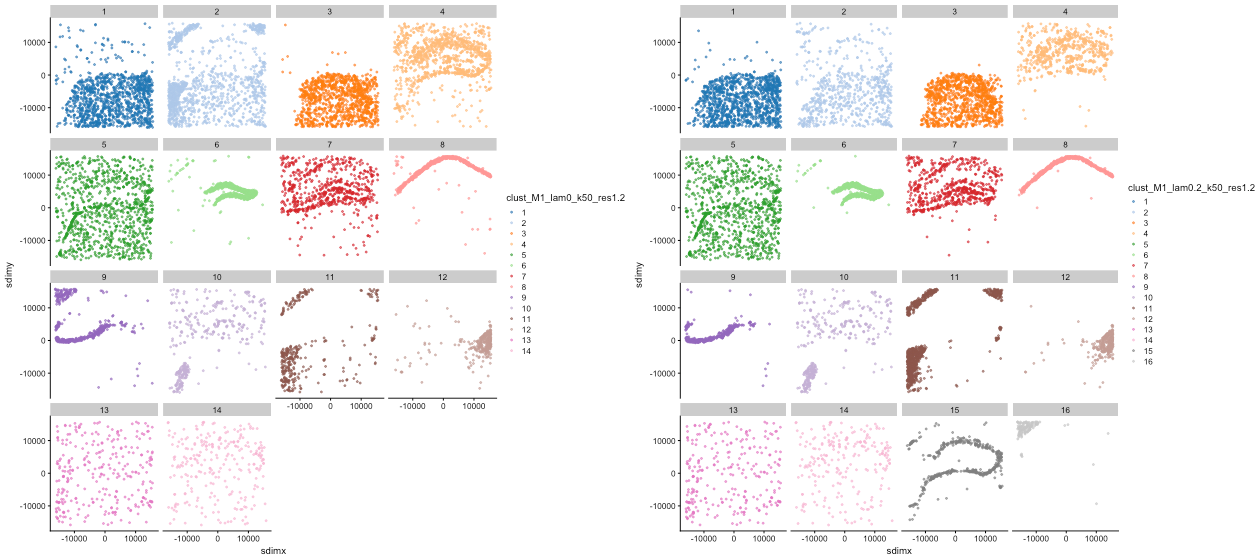
Figure: Banksy clustering separation effect demonstration. The left figure shows clustering results with λ=0 (14 clusters), and the right figure shows clustering results with λ=0.2 (16 clusters). By comparison, it can be seen that increasing spatial weight can identify finer spatial structures.
Notes and Best Practices
WARNING
Avoid Overinterpretation: Banksy results are inferred based on the calculation of spatial neighborhood features and do not equate to real biological interactions. Any key findings need to be confirmed by subsequent biological experiments.
CAUTION
Data Quality is Crucial: Banksy analysis has high requirements for the accuracy of spatial coordinate information. Low-quality spatial data may lead to false positive results. Please ensure spatial coordinate information is accurate and complete.
TIP
Parameter Optimization Suggestions:
- λ parameter: It is recommended to start from 0.2 and adjust according to data characteristics
- Resolution parameter: It is recommended to try multiple values and select the result with the most reasonable biological significance
- Clustering algorithm: It is recommended to try the Leiden algorithm first, and then try other algorithms if the effect is not good
NOTE
Results Affected by Parameters: Banksy analysis results will be affected by the selection of λ parameters, resolution parameters, and clustering algorithms. If the preliminary results are not ideal, you can try adjusting these parameters to re-analyze.
Frequently Asked Questions (FAQ)
Q1: How long does Banksy analysis take?
A: The analysis time depends on the data scale and computing resource configuration. Generally speaking:
- Small datasets (1,000-5,000 cells): 10-30 minutes
- Medium datasets (5,000-20,000 cells): 30 minutes-2 hours
- Large datasets (>20,000 cells): 2-8 hours or longer
Q2: How to select the λ parameter?
A: The λ parameter controls the importance of spatial information:
- λ = 0: Only use expression features, equivalent to traditional clustering
- λ = 0.2: Recommended starting value, balancing expression and spatial information
- λ = 0.5-1.0: More emphasis on spatial information, suitable for data with obvious spatial structure
- λ > 1.0: Overemphasis on spatial information, may lead to oversmoothing
Q3: How to select an appropriate clustering algorithm?
A: Different clustering algorithms are suitable for different scenarios:
- Leiden: Recommended as the first choice, suitable for most data
- Louvain: Similar to Leiden, but calculation speed may be faster
- K-means: Suitable for cases where the number of clusters is known
- Mclust: Suitable for complex data distributions
Q4: How to verify the reliability of Banksy analysis results?
A: The reliability of results can be verified through the following methods:
- Biological Verification: Combine known tissue structures and functional regions to verify clustering results
- Parameter Sensitivity: Test the stability of different parameter combinations
- Cross-Validation: Use different clustering algorithms to verify result consistency
- Functional Enrichment: Perform functional enrichment analysis on each cluster to verify biological significance
Q5: Which spatial transcriptomics technologies is Banksy suitable for?
A: Banksy is suitable for multiple spatial transcriptomics technologies:
- 10x Visium: Recommended λ = 0.2-0.5
- Slide-seq: Recommended λ = 0.1-0.3
- MERFISH: Recommended λ = 0.3-0.6
- CosMX: Recommended λ = 0.2-0.4
- SeekSpace: Recommended λ = 0.6-0.8
- Other Technologies: Adjust λ parameters according to spatial resolution
Q6: How to select an appropriate λ parameter?
A: The selection of λ parameter needs to consider the following factors:
- Spatial Resolution: High-resolution data can use smaller λ values
- Tissue Type: Tissues with complex structures can use larger λ values
- Analysis Objective: If more attention is paid to spatial continuity, use larger λ values
- Suggested Strategy: Start from 0.2 and gradually increase to 1.0, selecting the result with the most reasonable biological significance
Q7: What to do if clustering results are not ideal?
A: You can try the following optimization strategies:
- Adjust λ Parameter: Try different λ value combinations
- Adjust Resolution: Try different resolution parameters
- Change Clustering Algorithm: Try different algorithms such as Leiden, Louvain, K-means, etc.
- Check Data Quality: Ensure spatial coordinate information is accurate and complete
- Preprocessing Optimization: Check if data preprocessing steps are appropriate
References
Chung, J., et al. Banksy: spatial clustering with spatial omics data. Nature Genetics 56, 74–84 (2024). doi: 10.1038/s41588-024-01664-3.
Chung, J., et al. Spatial transcriptomics: technologies, applications and experimental considerations. Genomics 113, 1-15 (2021). doi: 10.1016/j.ygeno.2020.12.005.
Moses, L. & Pachter, L. Museum of spatial transcriptomics. Nature Methods 19, 534–546 (2022). doi: 10.1038/s41592-022-01409-2.